

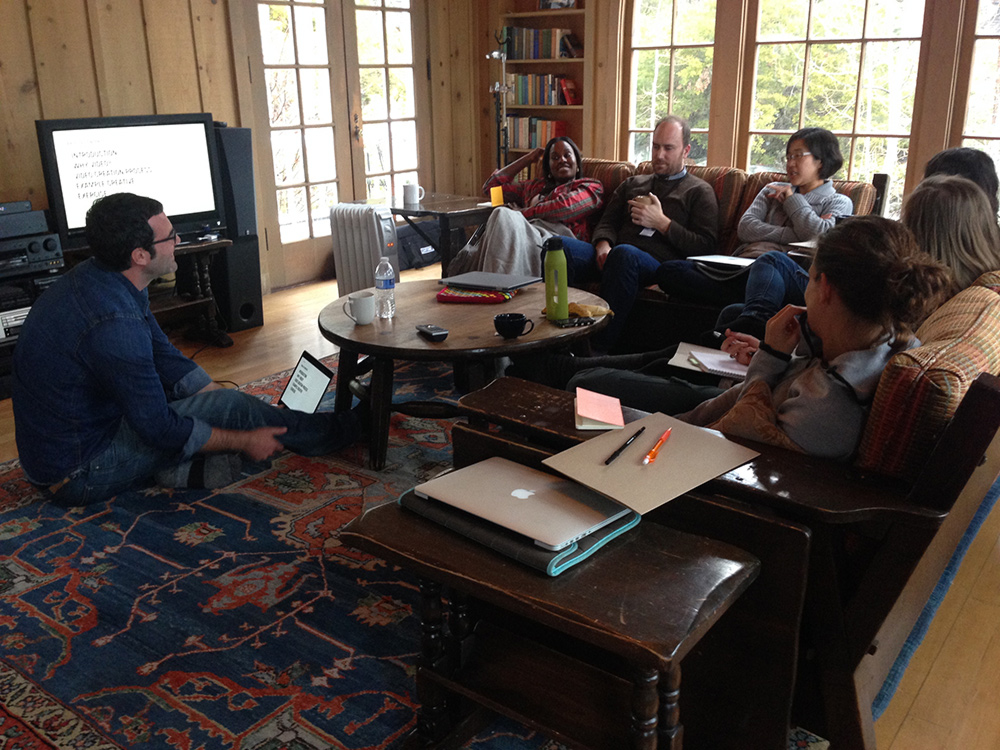
Content pages begin with a hero image
and bold introductory text. You can also
begin pages with a video.
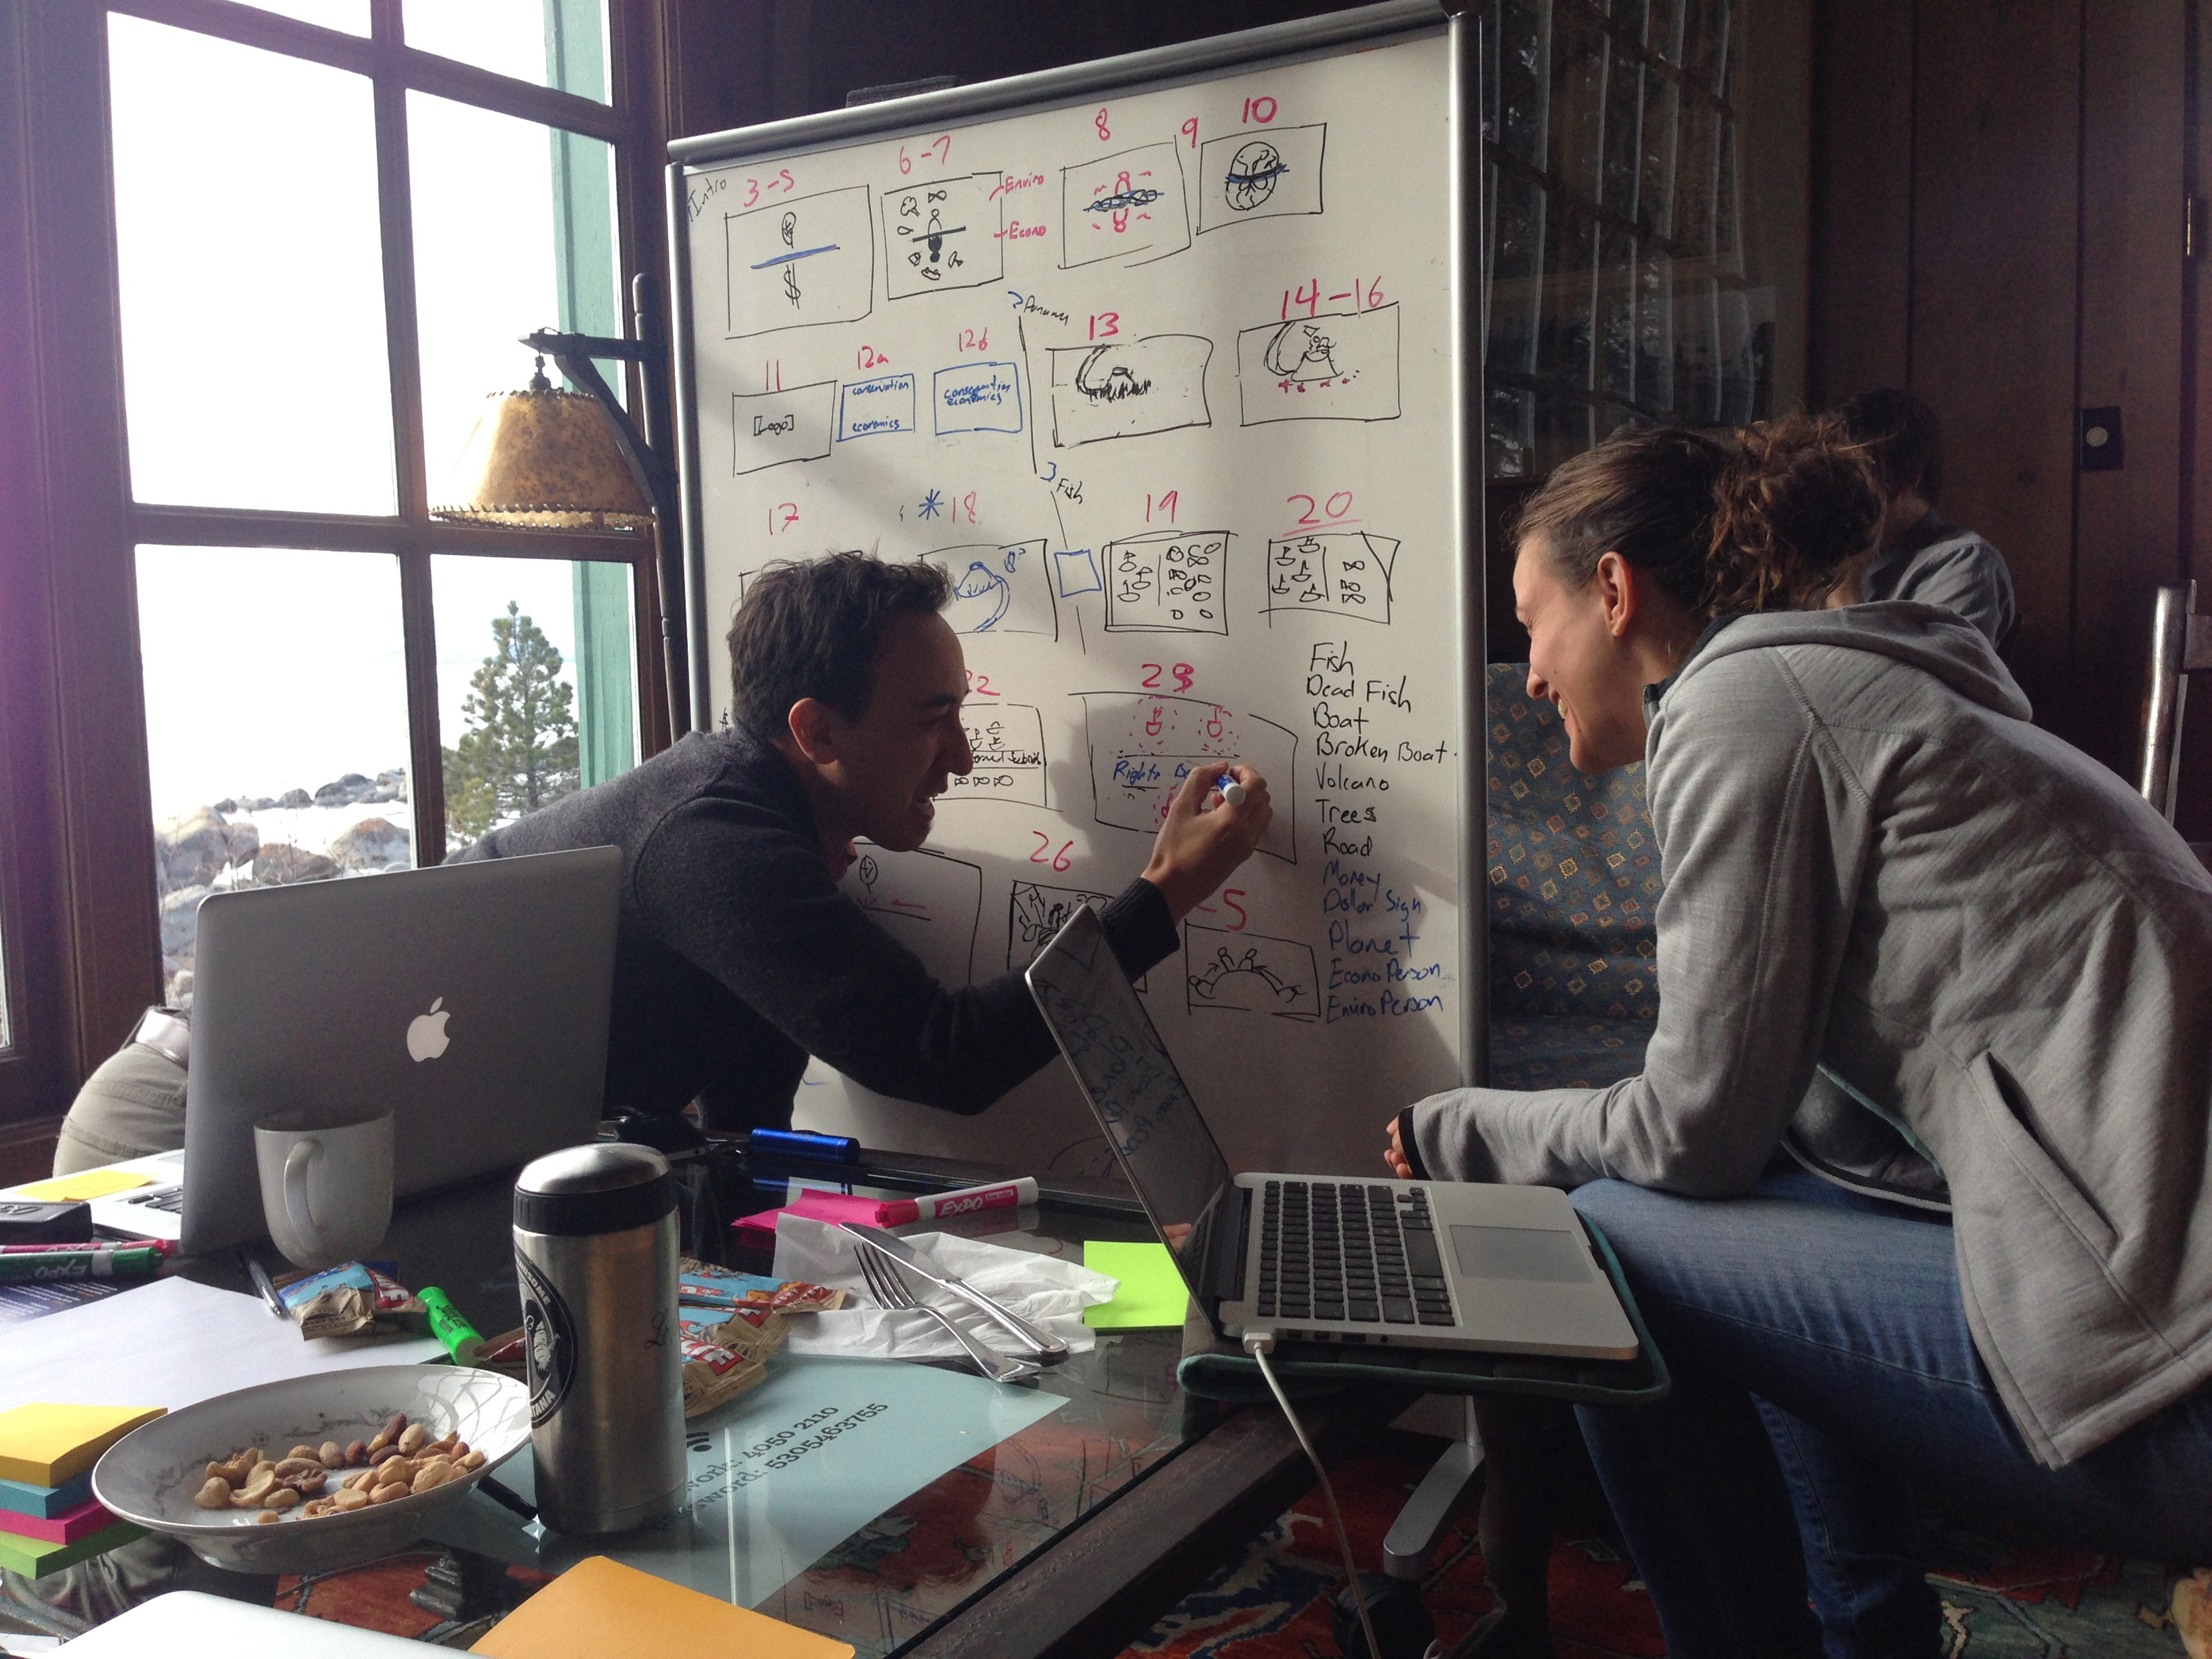
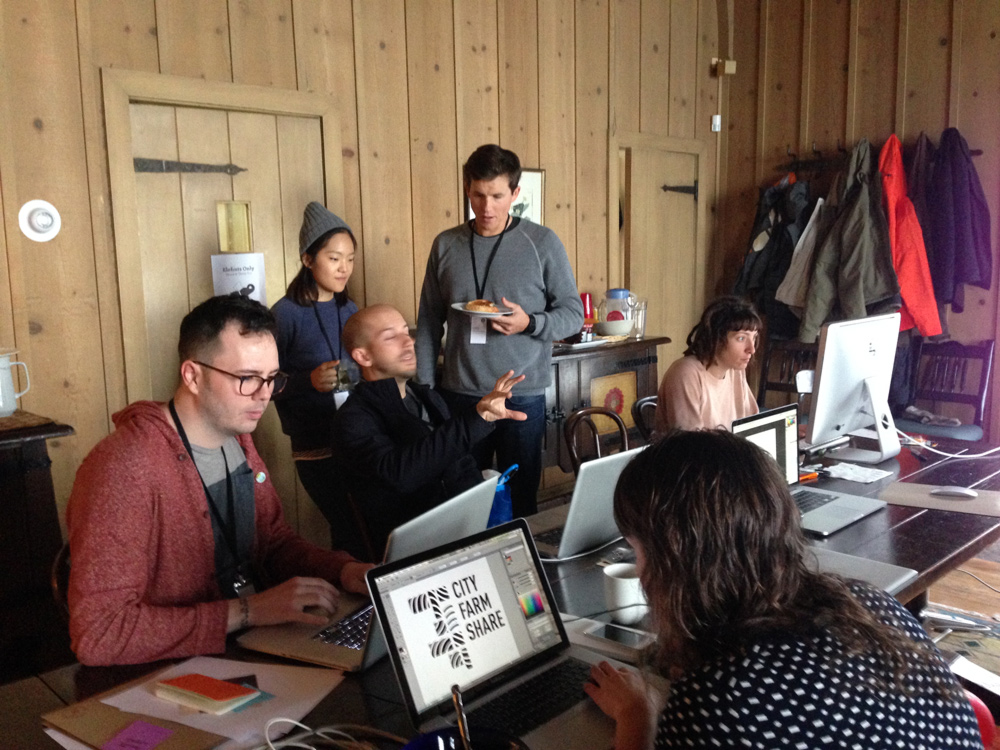
Pictured above: Elefint Designs' Desgn.It event, filmed by Rian Devos


Tell your organization’s story through highly customizable layouts
The digital annual report tool provides you with many options for displaying content. You can drag and drop these layouts in any order, allowing you to control how you tell your story.
Content can be grouped on a single scrolling page or split over multiple pages—for instance, to separate highlights from the past year from visualizations of financial data.
As the user scrolls down the page, the current story is dynamically highlighted in the side menu.
Layouts for Text & Embedded Content
You can easily insert text boxes with full editing capabilities at any point on the page.
Easily create layouts in 2 columns
- Each column has a full-formatting palette, giving you complete control over text styling.
- Text boxes can accommodate embedded content like images and videos
- You can edit using WordPress’s visual editor or use plain text to add custom HTML
- You can use 3rd party code in text boxes to include content such as embedded tweets.
“It is good to have an end to journey toward; but it is the journey that matters, in the end.” – Ernest Hemingway
— elefint designs (@elefint) January 2, 2015
A Block Quote
Call out important information using this attention-getting block format.
You can thank specific supporters, sponsors,
or partners at the end of each story
Layouts for Images & Video

You have the option of beginning each story with a featured image, but you also have several gallery options for displaying photos, video, and other content.
Photo Gallery


Video Gallery


This tabbed layout is a great way to present information without using too much real estate. You can use this layout to discuss strategic partnerships, events from the past year, programs, or more.
Anything you can do in a text box, you can do in these content tabs.
For instance, you can embed images in tabs
As well as videos:
The tab size will dynamically adjust to accommodate your content.
Lorem ipsum dolor sit amet, consectetur adipiscing elit. Etiam auctor, elit id fermentum dapibus, nulla nunc finibus ligula, quis condimentum lectus neque sit amet nisi. Nulla ultricies ut felis ut suscipit. Vivamus nec interdum dui, eu scelerisque ante. Maecenas semper, elit quis dignissim tincidunt, tellus magna blandit augue, id pulvinar risus diam non enim. Proin ac dolor sit amet lectus maximus cursus. Proin aliquam, diam a consectetur mollis, ante justo euismod tellus, vitae volutpat ipsum risus condimentum mauris. Nam eu lorem mattis, scelerisque ligula eu, commodo tortor.
Ut sed nunc sit amet felis egestas sodales at non mi. Proin a varius turpis. Suspendisse eu blandit dui. Vestibulum tempor ultrices pulvinar. Phasellus euismod tincidunt sem sit amet pellentesque. Vestibulum porttitor suscipit lorem, vel condimentum turpis cursus vel. In vel dolor nec neque efficitur luctus non quis augue. Nunc accumsan mauris leo, in pellentesque diam tristique scelerisque. Phasellus placerat ligula velit, ac cursus turpis venenatis sit amet. Lorem ipsum dolor sit amet, consectetur adipiscing elit. Phasellus eget odio eget sapien fringilla scelerisque vitae eu ipsum. Pellentesque ornare interdum nisl. In pharetra rhoncus consequat. Sed fringilla blandit vehicula. Donec quis dui quis justo tempus ultricies.
Layouts for Facts & Figures
Information can be presented graphically, as text, or even as embedded PDFs using services like Google Docs or Scribd.
2-column Icon Layout

An Icon or Chart
Can be accompanied by additional information for more context.

An Icon or Chart
Can be accompanied by additional information for more context.
3-Column Icon Layout

An Icon or Chart
Can be accompanied by additional information for
more context.

An Icon or Chart
Can be accompanied by additional information for
more context.

An Icon or Chart
Can be accompanied by additional information for
more context.
Call Out Facts in 2 or 3 Columns
An Icon or Chart
Can be accompanied by additional information for more context.

An Icon or Chart
Can be accompanied by additional information for more context.
An Icon or Chart
Can be accompanied by additional information for more context.

An Icon or Chart
Can be accompanied by additional information for more context.

An Icon or Chart
Can be accompanied by additional information for more context.
Of course, you can combine layout types however you like. Facts and figures can be followed by paragraphs of supporting information, or long text can be broken up with photo galleries. It’s highly flexible.
As you build your digital annual report, Elefint will happily provide guidance on crafting and presenting your content.